使用 Prometheus 收集 Docker 指標
Prometheus 是一個開源的系統監控和警報工具包。你可以將 Docker 配置為 Prometheus 目標。
警告
可用的指標以及這些指標的名稱正在積極開發中,可能隨時更改。
目前,你只能監控 Docker 本身。你目前無法使用 Docker 目標監控你的應用程式。
示例
以下示例展示瞭如何配置 Docker 守護程式、設定 Prometheus 在本地機器上作為容器執行以及使用 Prometheus 監控 Docker 例項。
配置守護程序
要將 Docker 守護程式配置為 Prometheus 目標,你需要在 daemon.json 配置檔案中指定 metrics-address。此守護程式預設情況下會期望該檔案位於以下位置之一。如果檔案不存在,請建立它。
- **Linux**:
/etc/docker/daemon.json - **Windows Server**:
C:\ProgramData\docker\config\daemon.json - **Docker Desktop**:開啟 Docker Desktop 設定,選擇 **Docker 引擎** 以編輯檔案。
新增以下配置
{
  "metrics-addr": "127.0.0.1:9323"
}
儲存檔案,或在 Docker Desktop for Mac 或 Docker Desktop for Windows 的情況下,儲存配置。重新啟動 Docker。
Docker 現在在環回介面上的埠 9323 上公開與 Prometheus 相容的指標。
建立 Prometheus 配置
複製以下配置檔案並將其儲存到您選擇的任何位置,例如 /tmp/prometheus.yml。這是一個標準的 Prometheus 配置檔案,除了在檔案底部添加了 Docker 作業定義。
# my global config
global:
  scrape_interval: 15s # Set the scrape interval to every 15 seconds. Default is every 1 minute.
  evaluation_interval: 15s # Evaluate rules every 15 seconds. The default is every 1 minute.
  # scrape_timeout is set to the global default (10s).

  # Attach these labels to any time series or alerts when communicating with
  # external systems (federation, remote storage, Alertmanager).
  external_labels:
    monitor: "codelab-monitor"

# Load rules once and periodically evaluate them according to the global 'evaluation_interval'.
rule_files:
  # - "first.rules"
  # - "second.rules"

# A scrape configuration containing exactly one endpoint to scrape:
# Here it's Prometheus itself.
scrape_configs:
  # The job name is added as a label `job=<job_name>` to any timeseries scraped from this config.
  - job_name: prometheus

    # metrics_path defaults to '/metrics'
    # scheme defaults to 'http'.

    static_configs:
      - targets: ["localhost:9090"]

  - job_name: docker
      # metrics_path defaults to '/metrics'
      # scheme defaults to 'http'.

    static_configs:
      - targets: ["host.docker.internal:9323"]
在容器中執行 Prometheus
接下來,使用此配置啟動 Prometheus 容器。
$ docker run --name my-prometheus \
    --mount type=bind,source=/tmp/prometheus.yml,destination=/etc/prometheus/prometheus.yml \
    -p 9090:9090 \
    --add-host host.docker.internal=host-gateway \
    prom/prometheus
如果你使用的是 Docker Desktop,--add-host 標誌是可選的。此標誌確保主機內部 IP 對 Prometheus 容器公開。Docker Desktop 預設情況下會這樣做。主機 IP 作為 host.docker.internal 主機名公開。這與前面步驟中 prometheus.yml 中定義的配置相匹配。
開啟 Prometheus 儀表板
驗證 Docker 目標是否列在 https://:9090/targets/ 上。
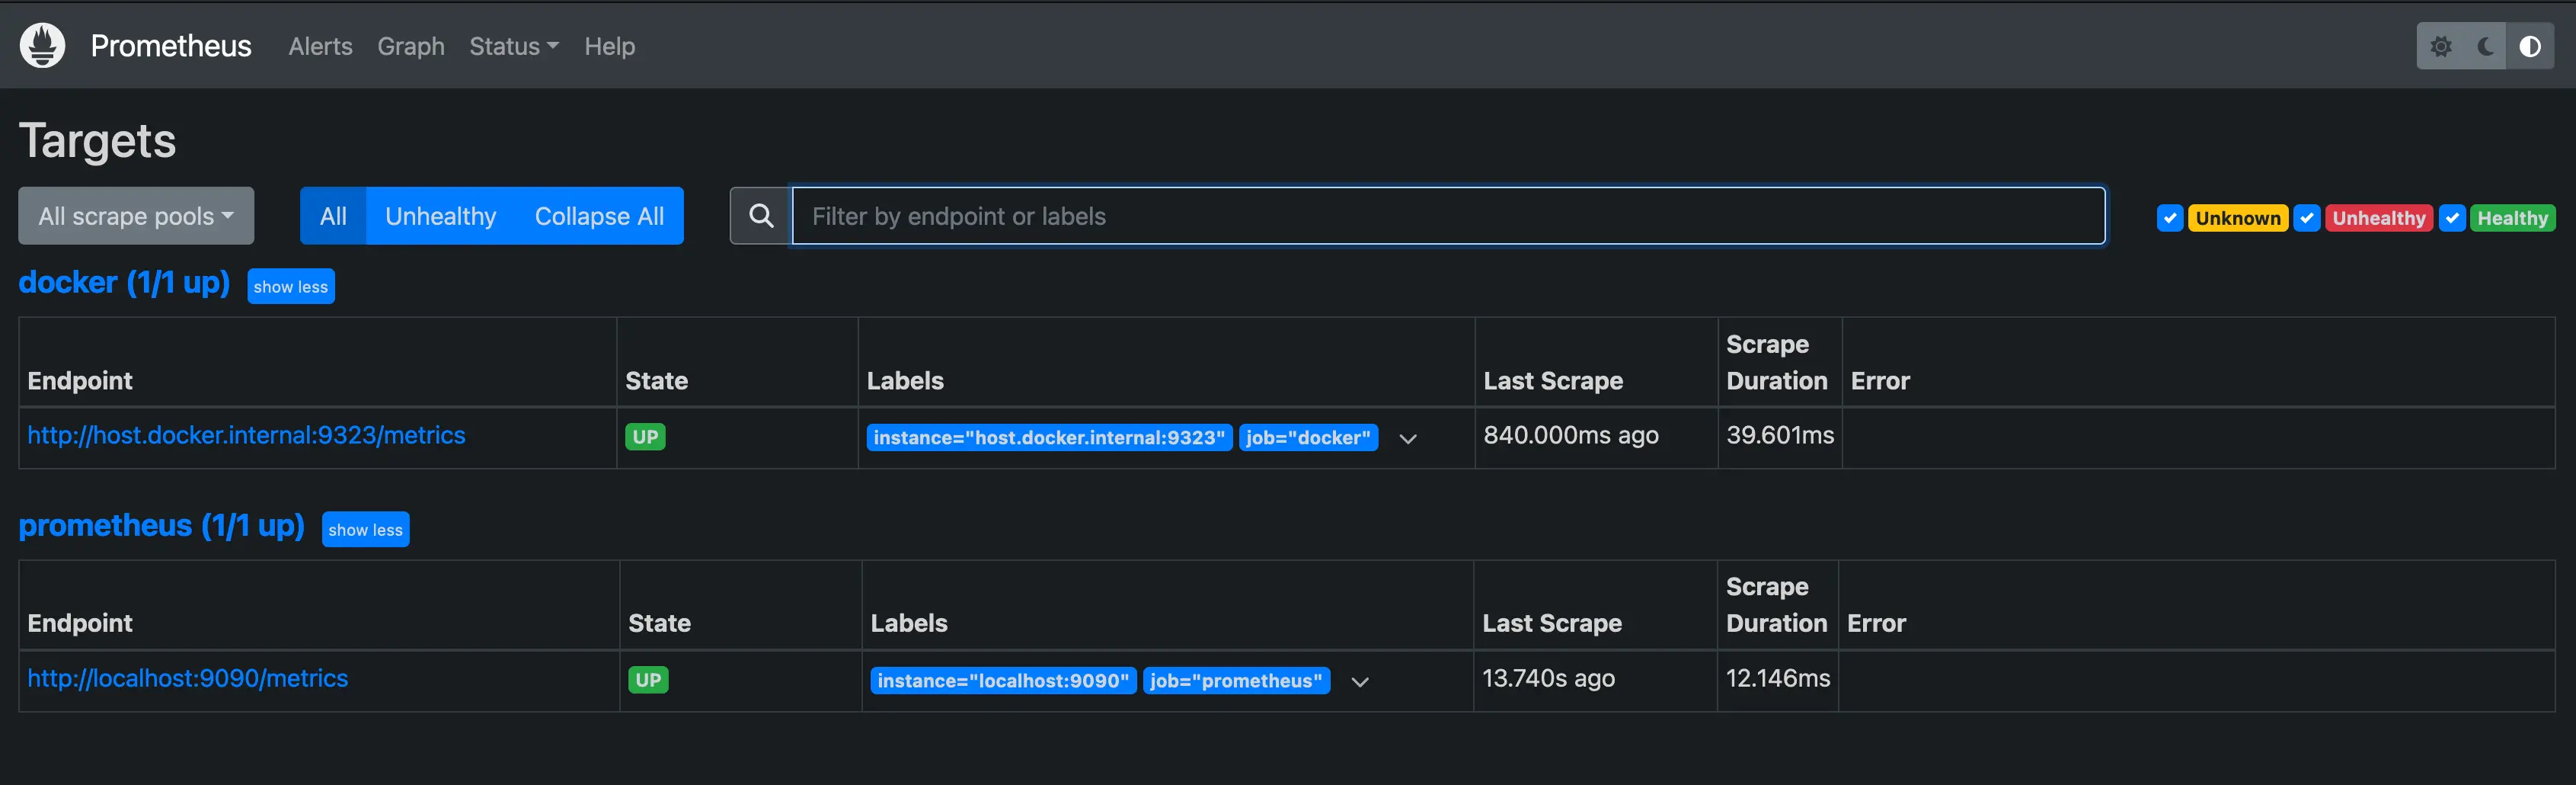
注意
如果你使用的是 Docker Desktop,你無法直接訪問此頁面上的端點 URL。
使用 Prometheus
建立圖表。在 Prometheus UI 中選擇 **圖表** 連結。從 **執行** 按鈕右側的組合框中選擇一個指標,然後點選 **執行**。下面的螢幕截圖顯示了 engine_daemon_network_actions_seconds_count 的圖表。
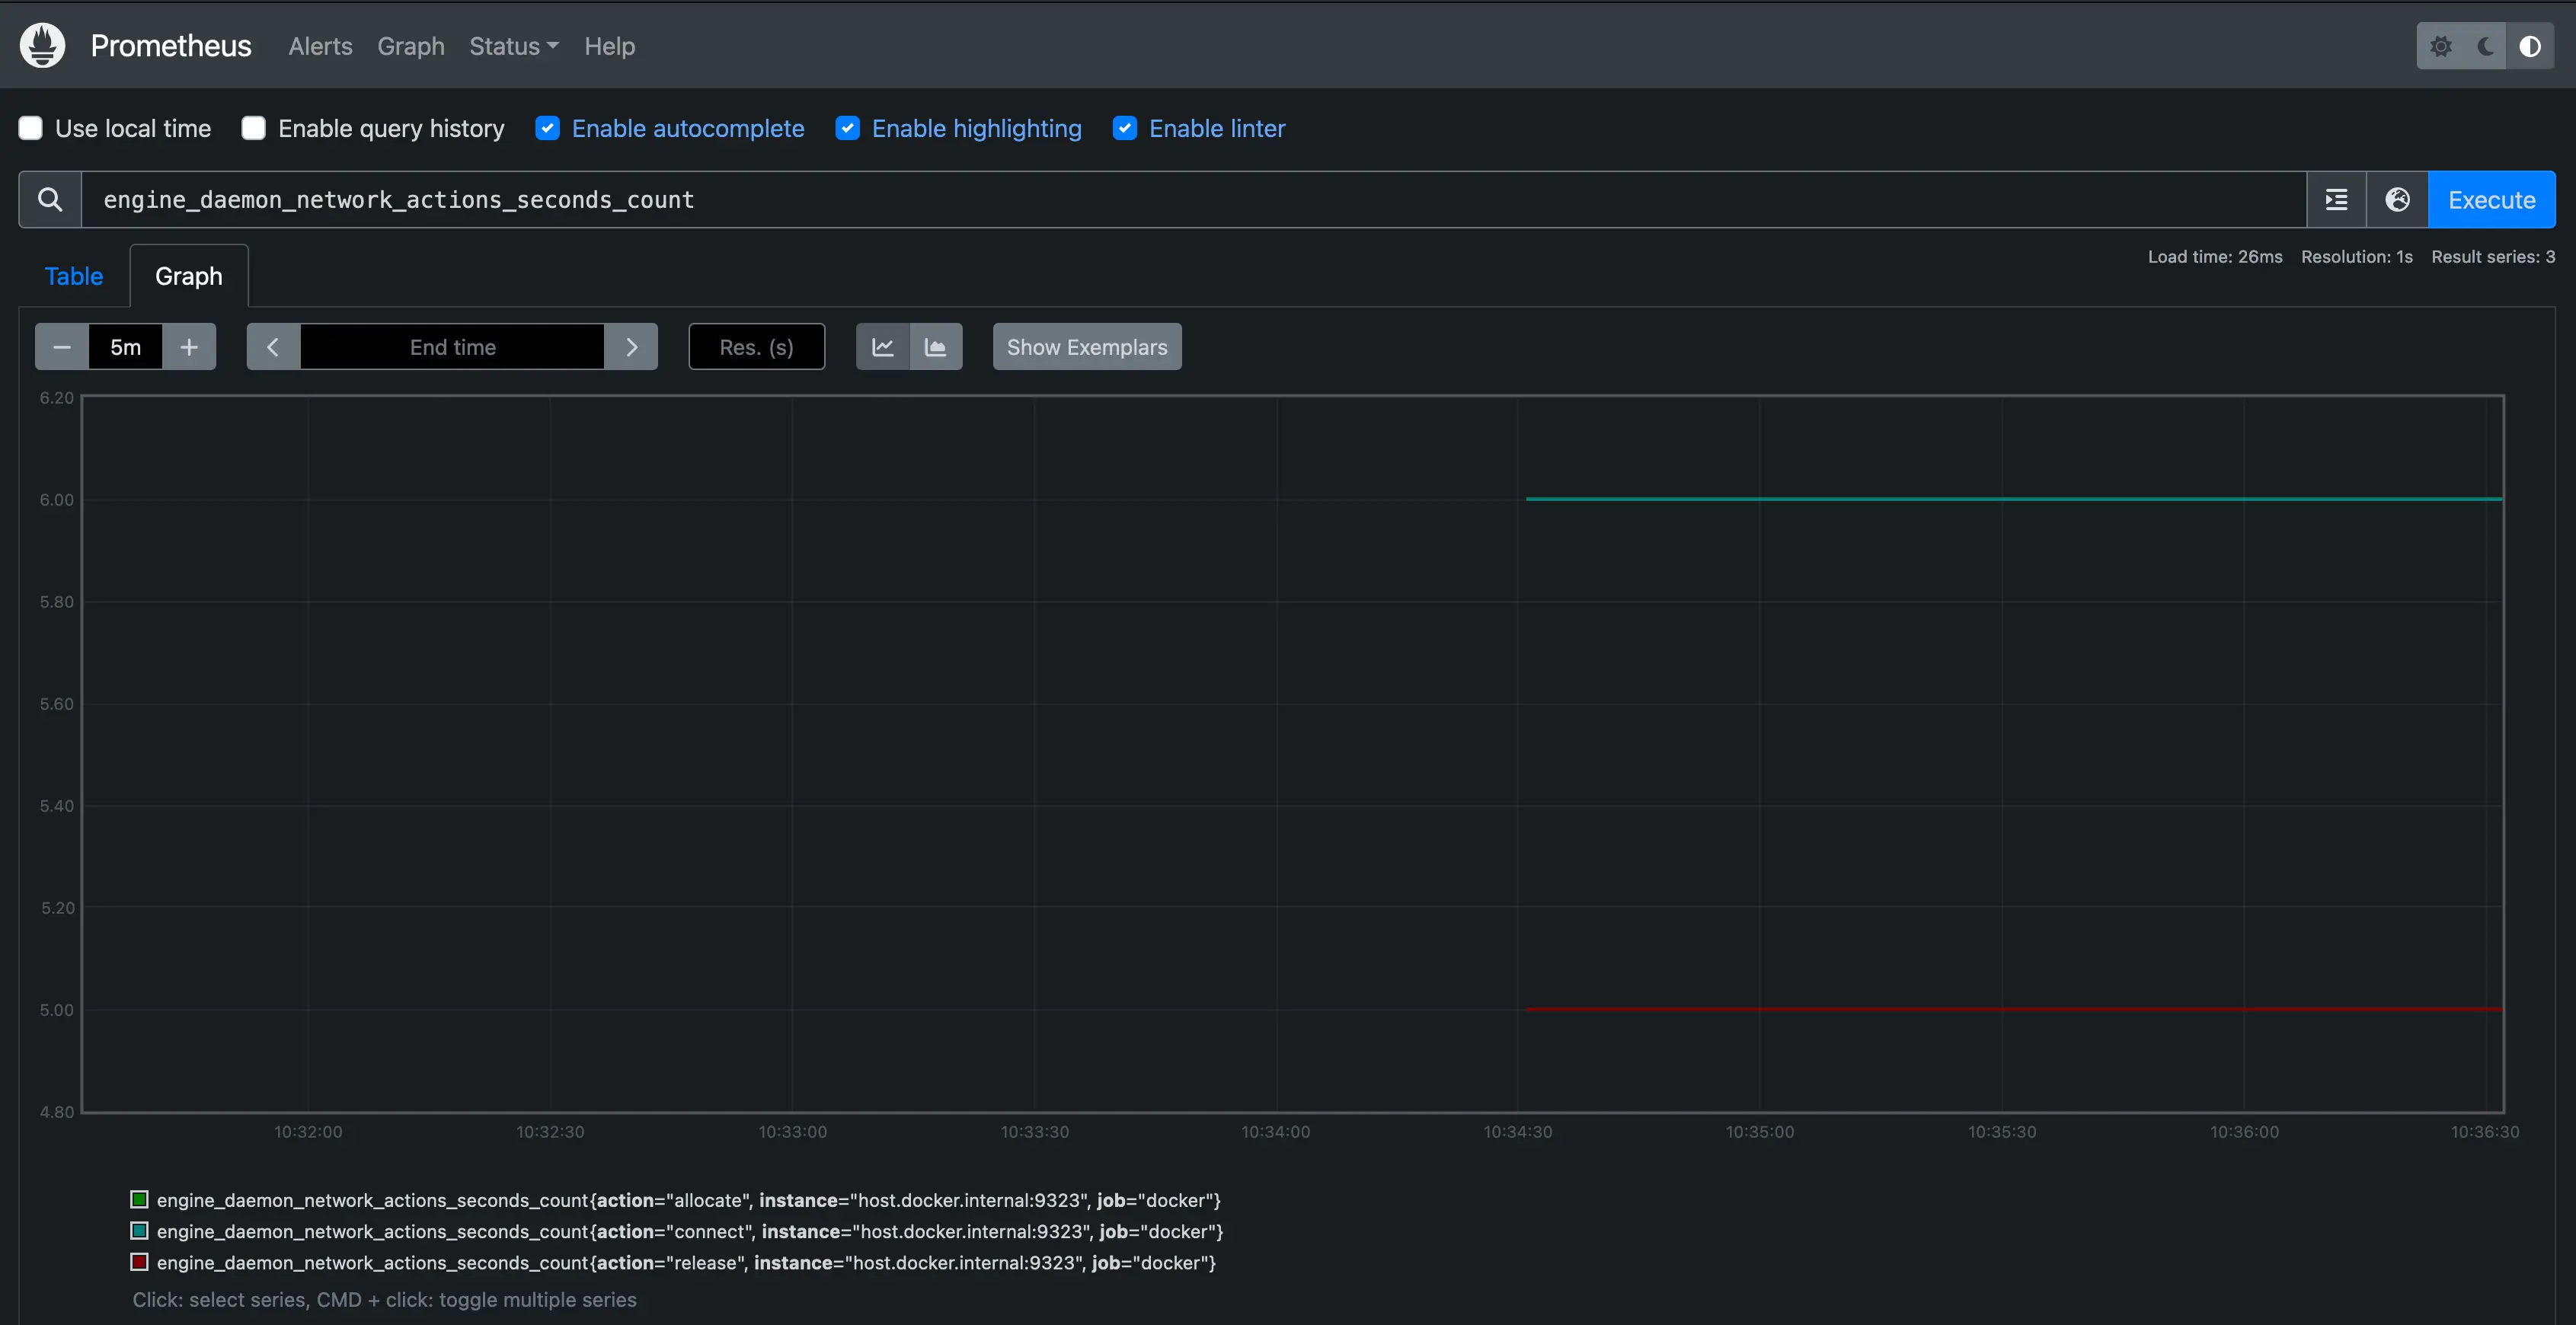
圖表顯示了一個相當空閒的 Docker 例項,除非你已經在你的系統上運行了活動的負載。
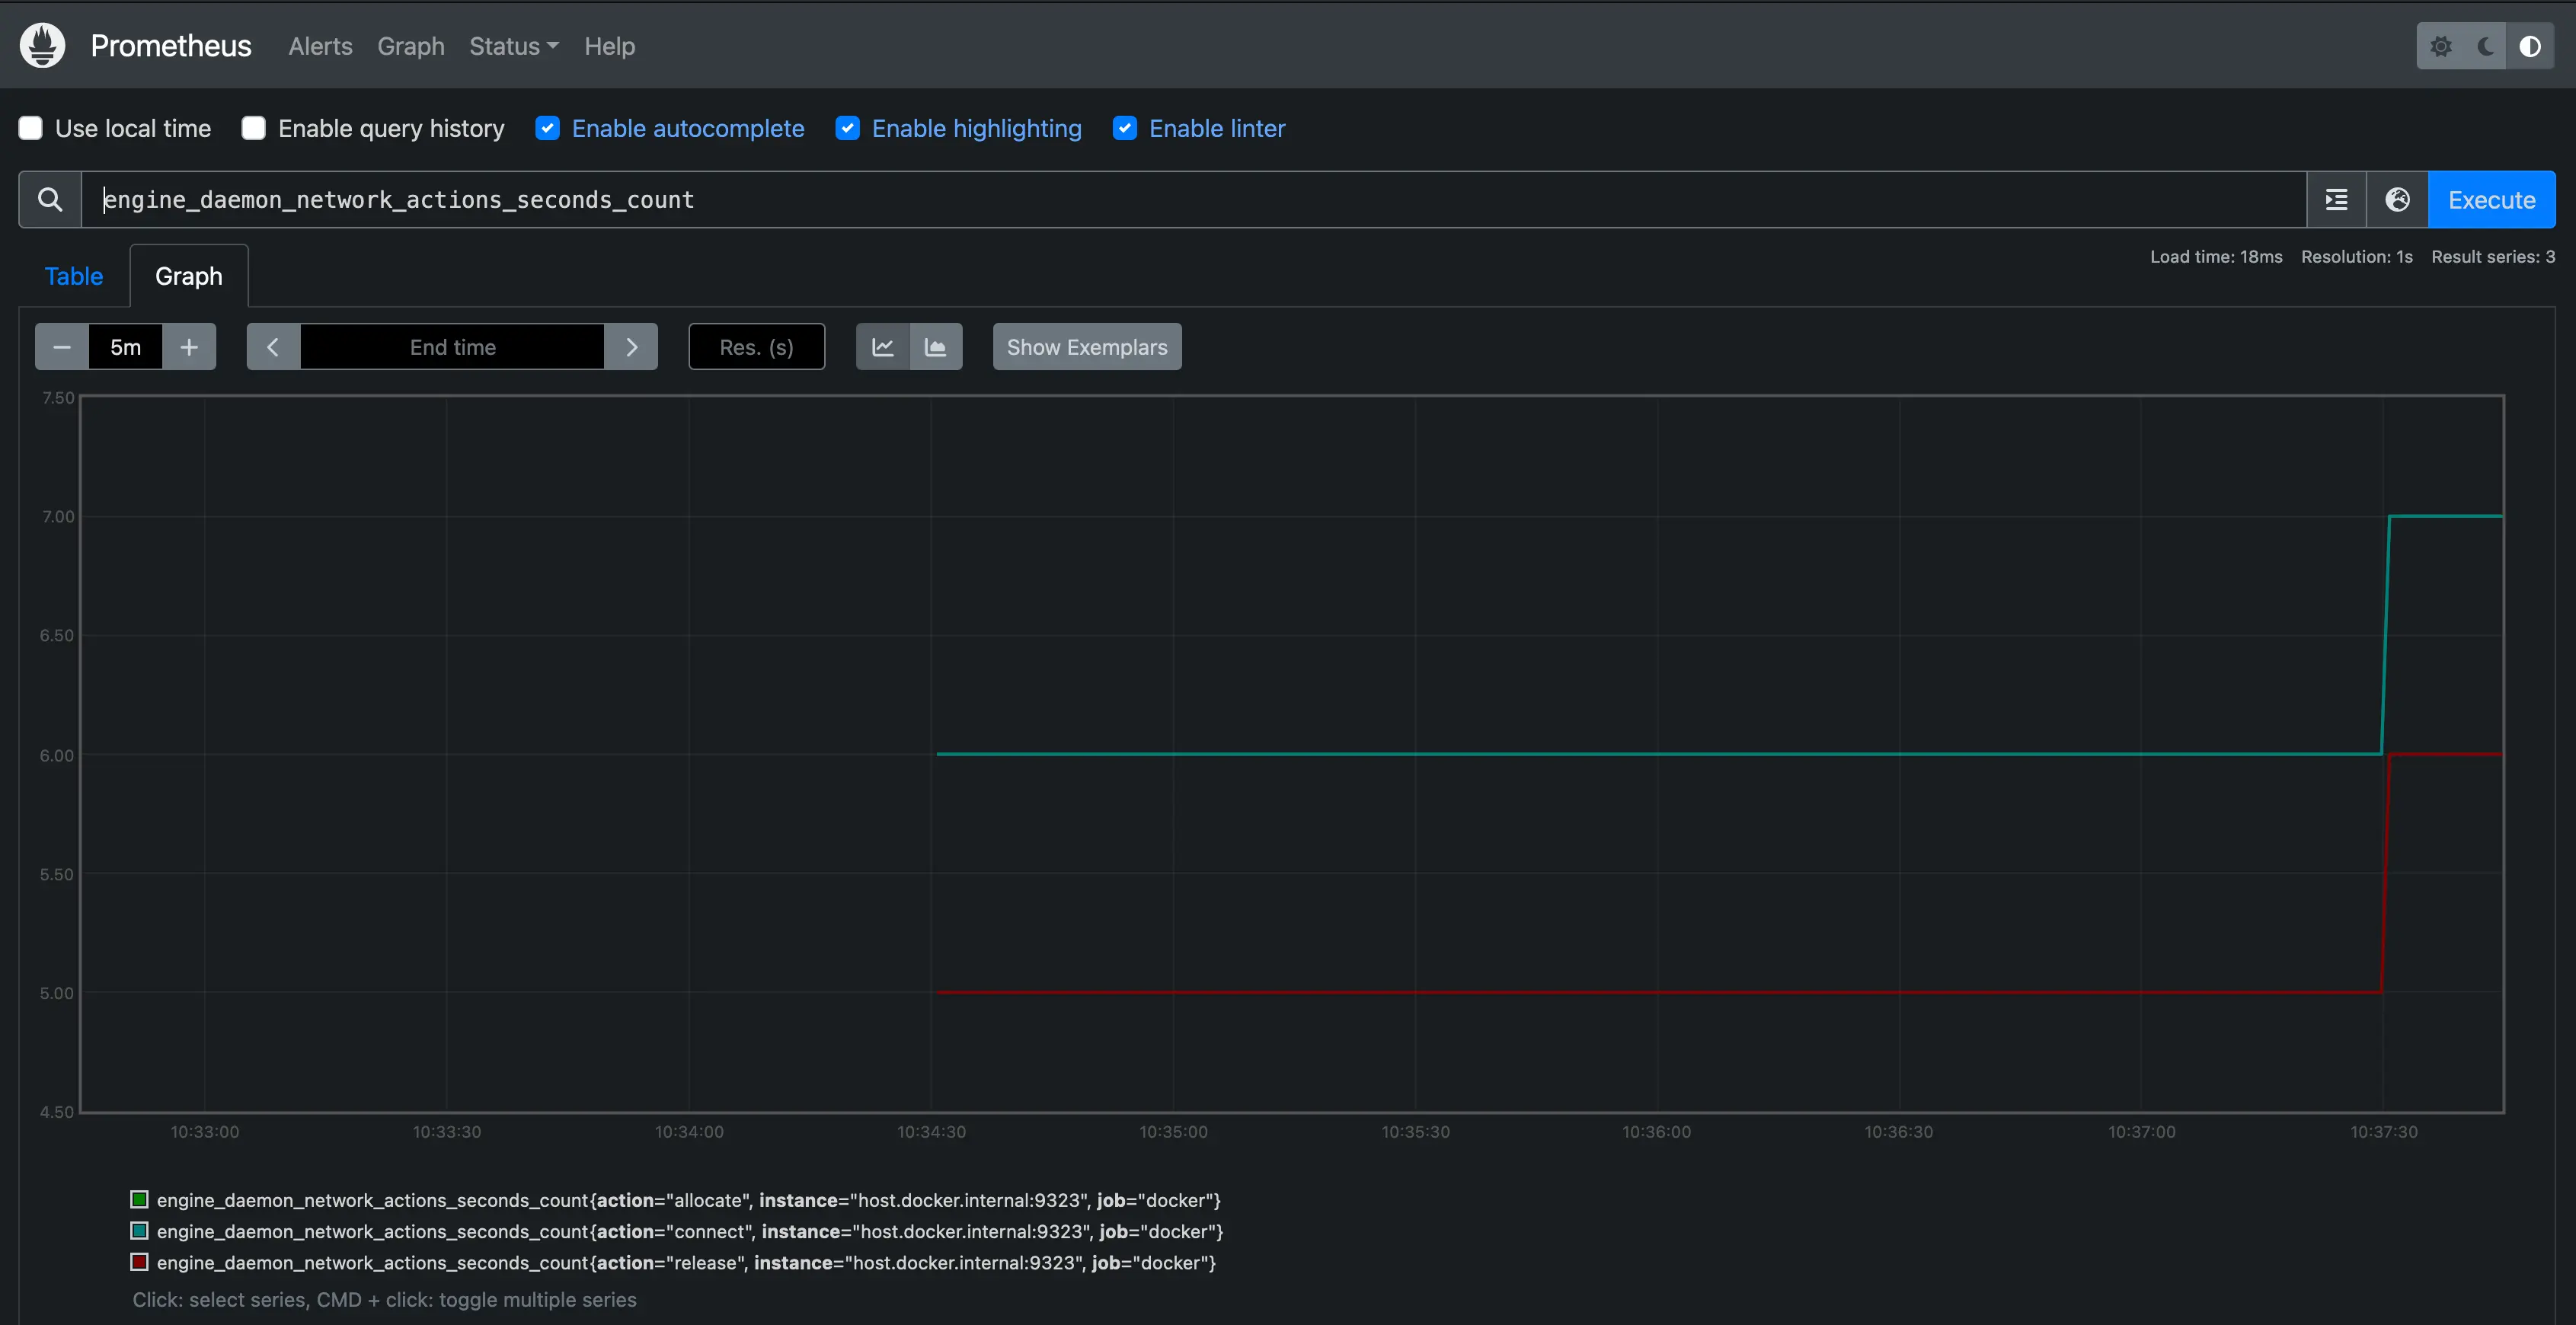
要使圖表更有趣,請執行一個使用一些網路操作的容器,方法是啟動使用包管理器下載一些包
$ docker run --rm alpine apk add git make musl-dev go
等待幾秒鐘(預設抓取間隔為 15 秒),然後重新載入圖表。你應該會看到圖表上升,顯示剛剛執行的容器導致的網路流量增加。
後續步驟
這裡提供的示例展示瞭如何在本地系統上將 Prometheus 作為容器執行。實際上,你可能在另一個系統上執行 Prometheus,或者作為某個雲服務的一部分。你也可以在這些上下文中將 Docker 守護程式設定為 Prometheus 目標。配置守護程式的 metrics-addr 並將守護程式的地址作為抓取端點新增到你的 Prometheus 配置中。
- job_name: docker
  static_configs:
    - targets: ["docker.daemon.example:<PORT>"]
有關 Prometheus 的更多資訊,請參閱 Prometheus 文件